Manual Runs
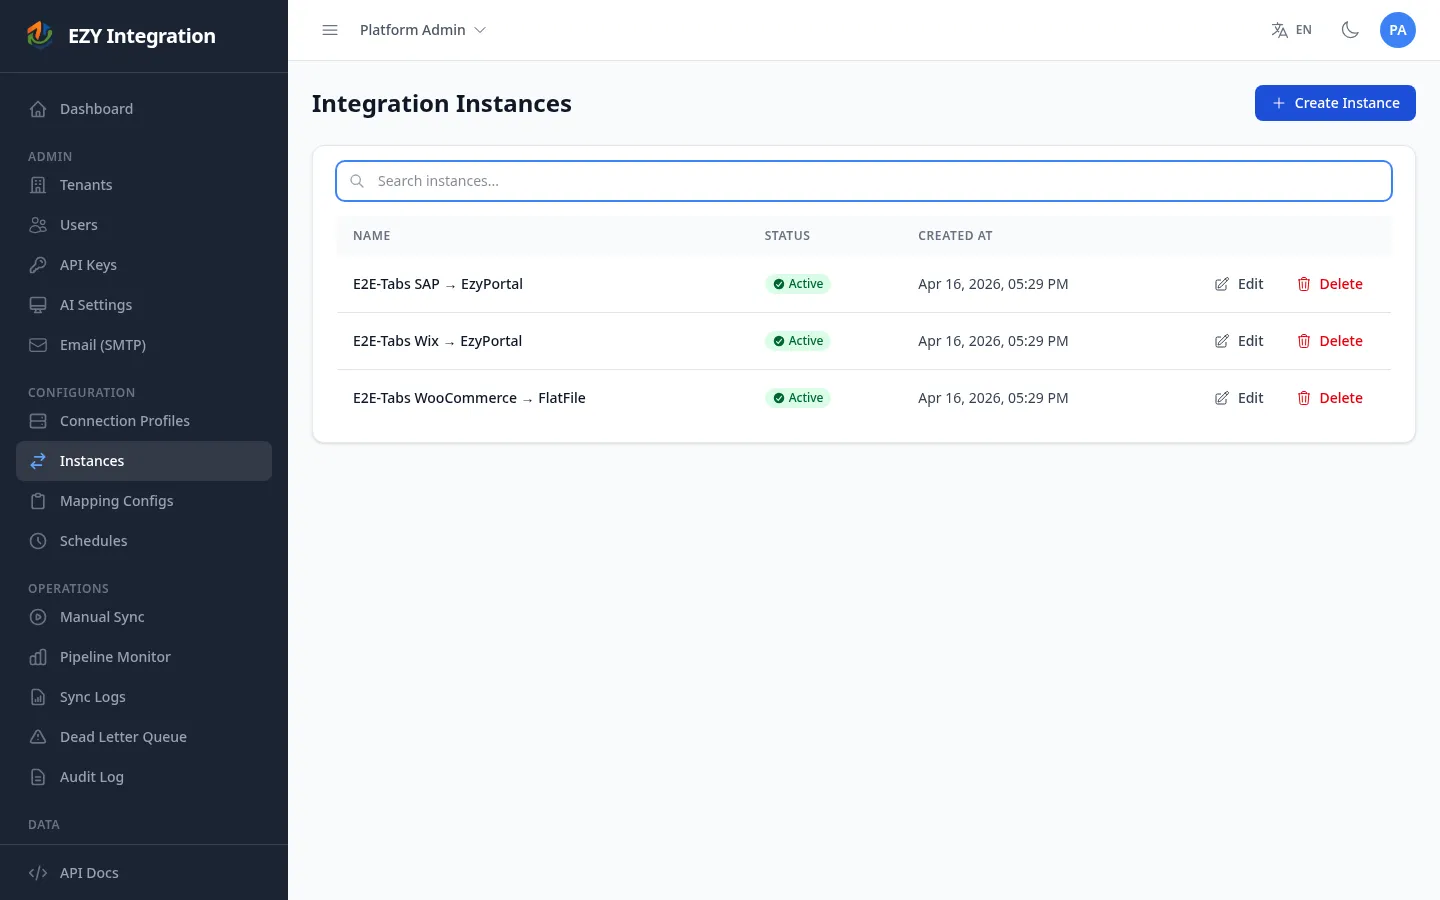
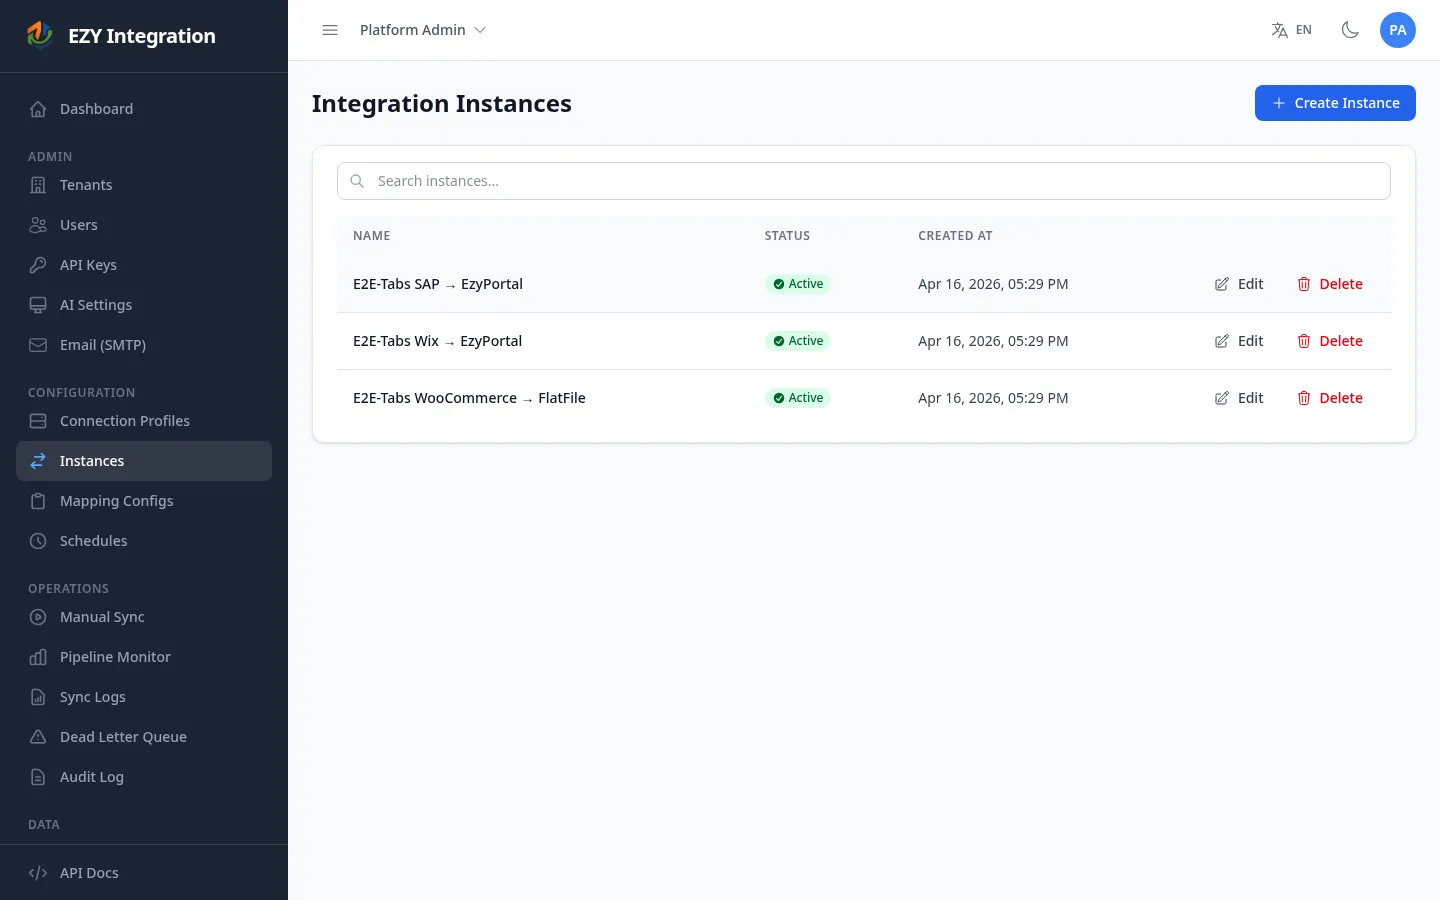
You can trigger an instance run at any time from the Sync Trigger page — without waiting for a scheduled run. Manual runs are useful for testing a new mapping configuration, recovering after a data gap, running a targeted sync for specific records, or running a one-off sync outside the normal schedule.
Accessing the Sync Trigger page
Section titled “Accessing the Sync Trigger page”In the left navigation, select Sync Trigger.
Triggering a manual run
Section titled “Triggering a manual run”- On the Sync Trigger page, select the Instance you want to run.
- Select the Entity Type to sync (for example,
item,bp, ororder). The list is filtered to entity types configured in the selected instance’s mapping configs. - Optionally enter one or more Source IDs (comma-separated) to limit the run to specific records from the source system.
- Choose the sync mode (see Incremental vs. full sync below).
- Optionally set Max Entities to cap how many records are processed in this run.
- Optionally adjust Batch Size (default: 100). Larger batches process faster but use more memory; smaller batches are safer for large or complex records.
- Click Trigger Sync.
The page immediately shows a live status panel for the run in progress.
Incremental vs. full sync
Section titled “Incremental vs. full sync”Every instance tracks a sync cursor — a bookmark that records how far the last run progressed (typically a date/time or a record ID). On each run, only records modified since the cursor position are processed.
| Option | What it does | When to use |
|---|---|---|
| Incremental (default) | Processes only records changed since the last run cursor. | Normal operation — daily or hourly syncs. |
| Reset Cursor | Clears the cursor so the next run starts from the beginning of the data set, then updates the cursor normally after. | Use after a data gap or when you need to pick up missed records without forcing a full re-send to the target. |
| Force Full Sync | Ignores the cursor and sends all records to the target system, regardless of modification date. | Use when the target system has lost data and needs a complete rebuild. Note: this sends every record through all pipeline stages and may take significantly longer. |
Monitoring a run in real time
Section titled “Monitoring a run in real time”After you click Trigger Sync, the status panel updates in real time:
- Extracting — the source system is being queried; discovered record count climbs as records are found.
- In Progress — records are flowing through the pipeline stages; the progress bar fills as records succeed, skip, or fail.
- Succeeded / Partial Success / Failed — final status once all records are processed.
The counters in the status panel show:
| Counter | Meaning |
|---|---|
| Total | Total records discovered from the source. |
| Success | Records that completed all pipeline stages and were written to the target. |
| Skipped | Records that were unchanged since the last run (smart sync) or explicitly excluded. |
| Failed | Records that could not be written after all retries. These are moved to the Dead Letter Queue. |
The Correlation ID displayed in the status panel is a unique identifier for this run. You can use it to look up the run in Run History or when contacting support.
Pipeline stage flow
Section titled “Pipeline stage flow”Each record processed by a run passes through five stages. If a stage fails, the record is retried automatically. After all retries are exhausted the record lands in the Dead Letter Queue.
flowchart LR
    A[Ingest] --> B[Normalize]
    B --> C[Transform]
    C --> D[Execute]
    D --> E[Finalize]
    D -->|all retries exhausted| F([Dead Letter Queue])
| Stage | What happens to the record |
|---|---|
| Ingest | The record is read from the source system and queued for processing. |
| Normalize | The raw source record is converted to the neutral canonical entity format. |
| Transform | The canonical entity is shaped into the payload format the target system expects, applying field mappings and value transformers. |
| Execute | The payload is sent to the target system. This is the stage where write failures most often occur. |
| Finalize | The result is recorded, counters are updated, and the sync cursor is advanced. |
Viewing run results after completion
Section titled “Viewing run results after completion”Once the run status shows Succeeded, Partial Success, or Failed, open Run History to see the full record-level detail. If any records failed, open the Dead Letter Queue to inspect and replay them.
Related pages
Section titled “Related pages”- Jobs Overview — what instances are and how to manage them.
- Schedules — automate runs on a recurring cadence.
- DLQ and Message Replay — handle failed records.
- Run History — view the full history of completed runs.