Pipeline Health
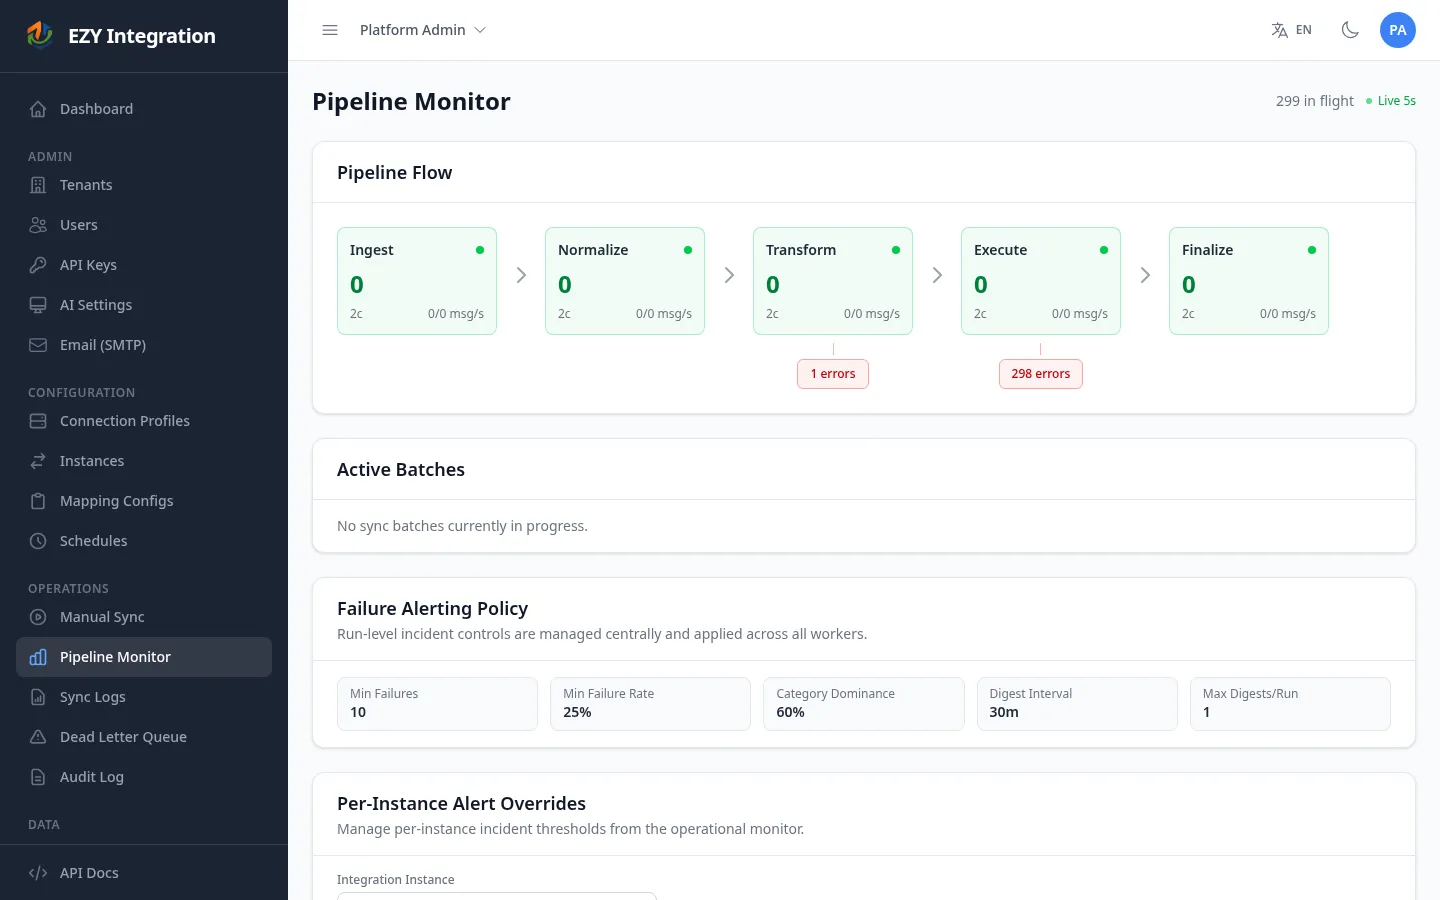
The Pipeline Monitor page shows the live state of the processing pipeline. It refreshes automatically every five seconds and displays how many records are waiting at each stage, how fast records are flowing through, which batches are currently running, and whether any stage has backed up messages that need attention. Use it for at-a-glance health checks and as the first stop when a sync seems slower than expected.
Accessing the page
Section titled “Accessing the page”In the left navigation, under Operations, select Pipeline Monitor.
A Live 5s indicator in the page header confirms the display is refreshing in real time. The header also shows the current total number of records in flight across all stages.
Reading the pipeline flow
Section titled “Reading the pipeline flow”The Pipeline Flow card shows one box per processing stage, arranged left to right in the order records move through them:
graph LR
    A[Ingest] --> B[Normalize]
    B --> C[Transform]
    C --> D[Execute]
    D --> E[Finalize]
    D -->|on failure| F[Error]
Each stage box displays:
| Indicator | Meaning |
|---|---|
| Stage name | The human-readable label for this processing step. |
| Message count | Number of records currently waiting to be processed at this stage. |
| Status dot | Green when the count is low; turns amber or red as the count grows. |
| Consumer count | Number of active workers processing records at this stage. |
| Throughput | Publish rate and delivery rate in messages per second, shown as in/out msg/s. |
Below each stage box, a smaller error count box appears if any records have failed at that stage and are awaiting attention. These records have not been automatically retried.
What a healthy pipeline looks like
Section titled “What a healthy pipeline looks like”- All stage boxes show a low or zero message count.
- Status dots are green.
- Throughput numbers are non-zero when a sync is running.
- Active Batches shows running batches with progress advancing over time.
- The Recent Failed Runs table is empty or shows a low failure percentage.
Warning signs
Section titled “Warning signs”| Sign | Likely cause | What to do |
|---|---|---|
| One stage has a large and growing message count | Processing is backed up at that stage — workers may be stalled or a downstream system is slow | Check Sync Logs for error messages; escalate if messages do not drain within a few minutes |
| Error count box appears under a stage | Records failed at that stage and need manual action | Open DLQ and Replay to inspect and replay or discard them |
| All stage boxes show zero consumers | Workers are not running | Contact your system administrator |
| Active batch shows no progress for several minutes | The batch may be stalled | Use the Purge option (admin only) to cancel the stalled batch, then re-trigger the run |
| ”Unable to connect” message in the flow card | The health monitoring service cannot reach the pipeline backend | Contact your system administrator |
Active batches
Section titled “Active batches”The Active Batches card lists every batch sync currently in progress. For each batch you can see:
- The integration instance name and entity type being synced.
- How the batch was triggered (scheduled, manual, or dependency cascade).
- Time elapsed since the batch started.
- A progress bar showing records processed out of total, split into green (success), grey (skipped), and red (failed) segments.
- The number of failures, if any.
When a batch is in the extraction phase and the total record count is not yet known, the progress bar pulses blue with an “Extracting…” label.
Administrators can cancel a single stalled batch using the Purge button on its card, or cancel all running batches at once using Purge All. Both actions are irreversible — pending records in the cancelled batch are discarded.
Failure alerting policy
Section titled “Failure alerting policy”The Failure Alerting Policy card shows the global thresholds that trigger an incident notification when a run produces too many failures:
| Field | Description |
|---|---|
| Min Failures | Minimum number of failed records before an incident is raised. |
| Min Failure Rate | Minimum failure percentage before an incident is raised. |
| Category Dominance | Minimum percentage of failures that must belong to one error category for a digest to be sent. |
| Digest Interval | How often (in minutes) the system sends a failure digest email. |
| Max Digests/Run | Maximum number of digest emails sent per run. |
These thresholds apply globally. Administrators can set per-instance overrides in the Per-Instance Alert Overrides card below it — useful when a specific instance tolerates a higher failure rate than the system default.
Recent failed runs
Section titled “Recent failed runs”The Recent Failed Runs table shows integration runs that ended with a high failure percentage. For each run you can see the instance name, entity type, final status, failed record count out of total, the failure percentage, and the start time. Use this table for incident triage when you need a quick list of which jobs are failing without searching through Sync Logs.
When to escalate
Section titled “When to escalate”Self-service actions available from this page:
- Replay failed records from the DLQ (see DLQ and Replay).
- Purge a stalled batch (admin role required).
- Adjust per-instance alert thresholds (admin role required).
Escalate to your system administrator when:
- Workers show zero consumers and do not recover after a few minutes.
- The pipeline flow card shows a connection error.
- A stage queue continues to grow without draining after replaying or purging.
Related pages
Section titled “Related pages”- Sync Logs — per-record synchronization history
- DLQ and Replay — replay or discard failed records
- Audit Log — configuration change history
- Common Errors — error patterns and resolutions