Sync Logs (Run History)
Sync Logs (run history) is the operational record of every individual synchronization operation the pipeline has processed. Each row represents one entity record moving through the pipeline — its source ID, the instance that processed it, the operation performed, the final status, and any error message. Use Sync Logs to confirm that specific records reached the target system, count failures for a given entity type, or isolate the exact error message that caused a record to fail.
Accessing the page
Section titled “Accessing the page”In the left navigation, under Operations, select Sync Logs.
Summary statistics
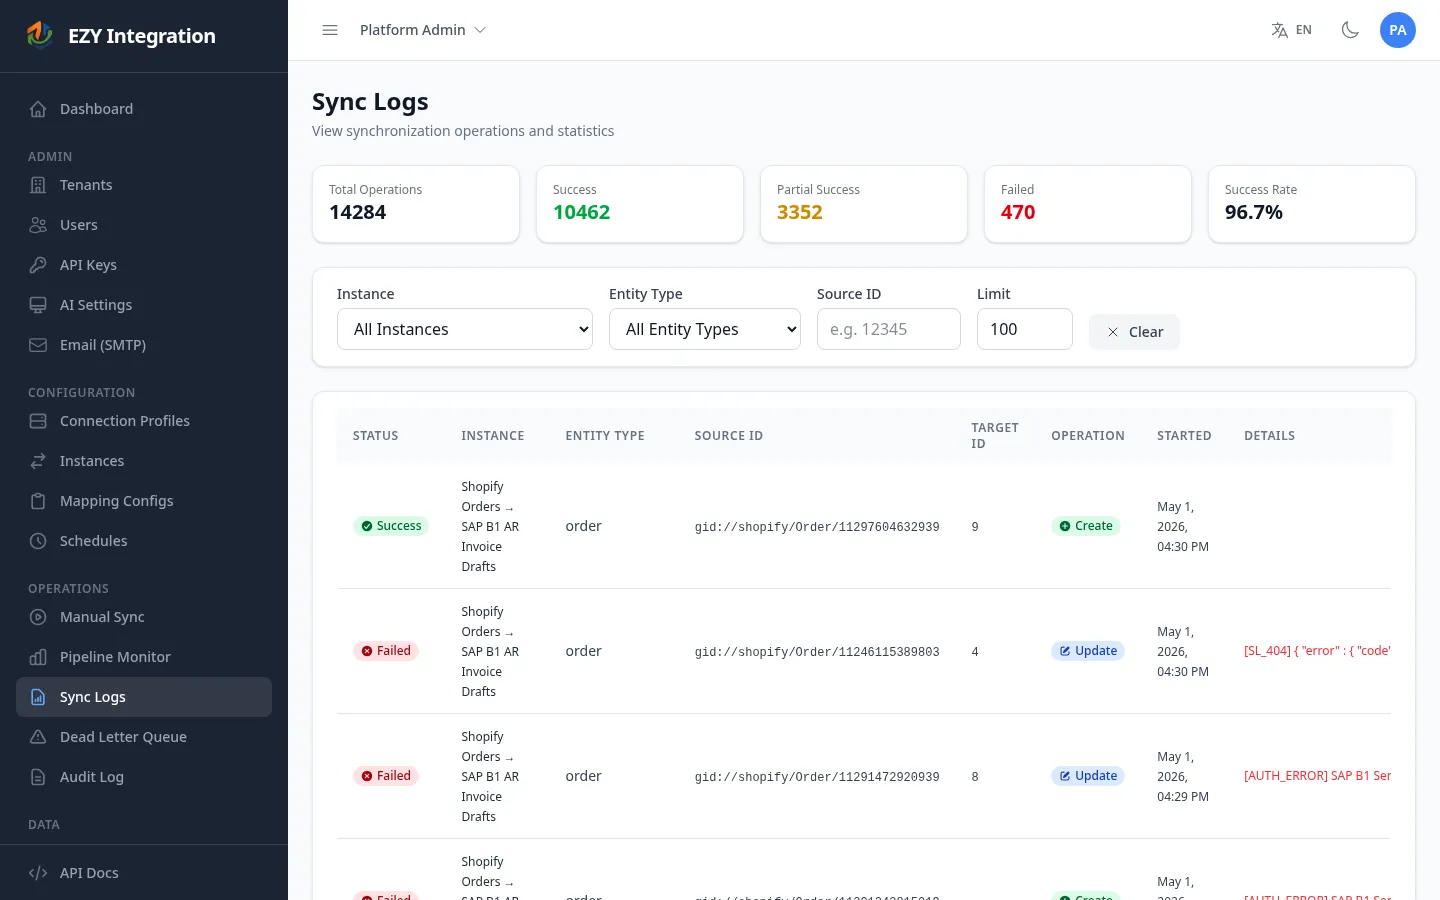
Section titled “Summary statistics”At the top of the page, five stat cards give an at-a-glance view of the records currently loaded:
| Card | Description |
|---|---|
| Total Operations | Count of all rows matching the current filters |
| Success | Records that completed without error |
| Partial Success | Records where the main write succeeded but one or more sub-steps (such as image sync or metafield sync) reported a partial result |
| Failed | Records that could not be delivered to the target system |
| Success Rate | Percentage of successful operations out of the total |
Run status values
Section titled “Run status values”Each row carries one of the following status badges:
| Status | Color | Meaning |
|---|---|---|
| Success | Green | The record was written to the target system without error. |
| Completed | Green | Alternate success state used by some pipeline stages. |
| Partial Success | Amber | The core write succeeded but at least one dependent sub-step (image, metafield, inventory) reported a partial result. |
| Partially Failed | Amber | A subset of sub-steps failed; the main record may still exist in the target system. |
| In Progress | Blue | The pipeline is actively processing this record. |
| Extracting | Blue | The source extractor is fetching data for this record. |
| Failed | Red | The record could not be written and no further retries will be attempted automatically. Check the Details column for the error message. |
| Extraction Failed | Red | The source extractor could not retrieve the record data. |
List columns
Section titled “List columns”| Column | Description |
|---|---|
| Status | Status badge for this record (see table above). |
| Instance | Name of the integration job (instance) that processed this record. |
| Entity Type | The type of entity — for example, item, bp, or order. |
| Source ID | The identifier of the record in the source system. |
| Target ID | The identifier assigned in the target system after a successful write. Blank if the write failed. |
| Operation | Whether the pipeline created, updated, or deleted the record in the target system. |
| Started | Date and time when this record entered the pipeline. |
| Details | Error message, if any. Hover over a truncated message to read it in full. |
Filtering and searching
Section titled “Filtering and searching”Use the filter bar above the table to narrow results:
| Filter | Values |
|---|---|
| Instance | Select a specific integration job, or leave blank to show all instances. |
| Entity Type | Select a specific entity type. The list updates based on the selected instance. |
| Source ID | Enter a partial or full source-system identifier to find a specific record. |
| Limit | Number of rows to load (default 100). Increase if you need to see older records. |
Select Clear to reset all filters to their defaults.
Drilling into a specific run
Section titled “Drilling into a specific run”Sync Logs shows per-record entries rather than grouped run summaries. To review all records from a single run (batch sync), filter by the instance and then look for records with the same Started timestamp cluster. For a grouped view of run outcomes with totals and correlation IDs, open the instance detail page from Instances in the navigation.
For records in a Failed or Partial state, the Details column contains the error message returned by the target system. Use this message to determine whether the failure is a data problem (such as a missing required field) or a connectivity problem (such as an authentication error).
Records that exhaust all automatic retries are moved to the Dead Letter Queue. See DLQ and Replay to replay or discard them.
Related pages
Section titled “Related pages”- Jobs Overview — understand instances and how runs are triggered
- DLQ and Replay — replay failed records
- Audit Log — configuration change history
- Common Errors — error patterns and resolutions