Activity
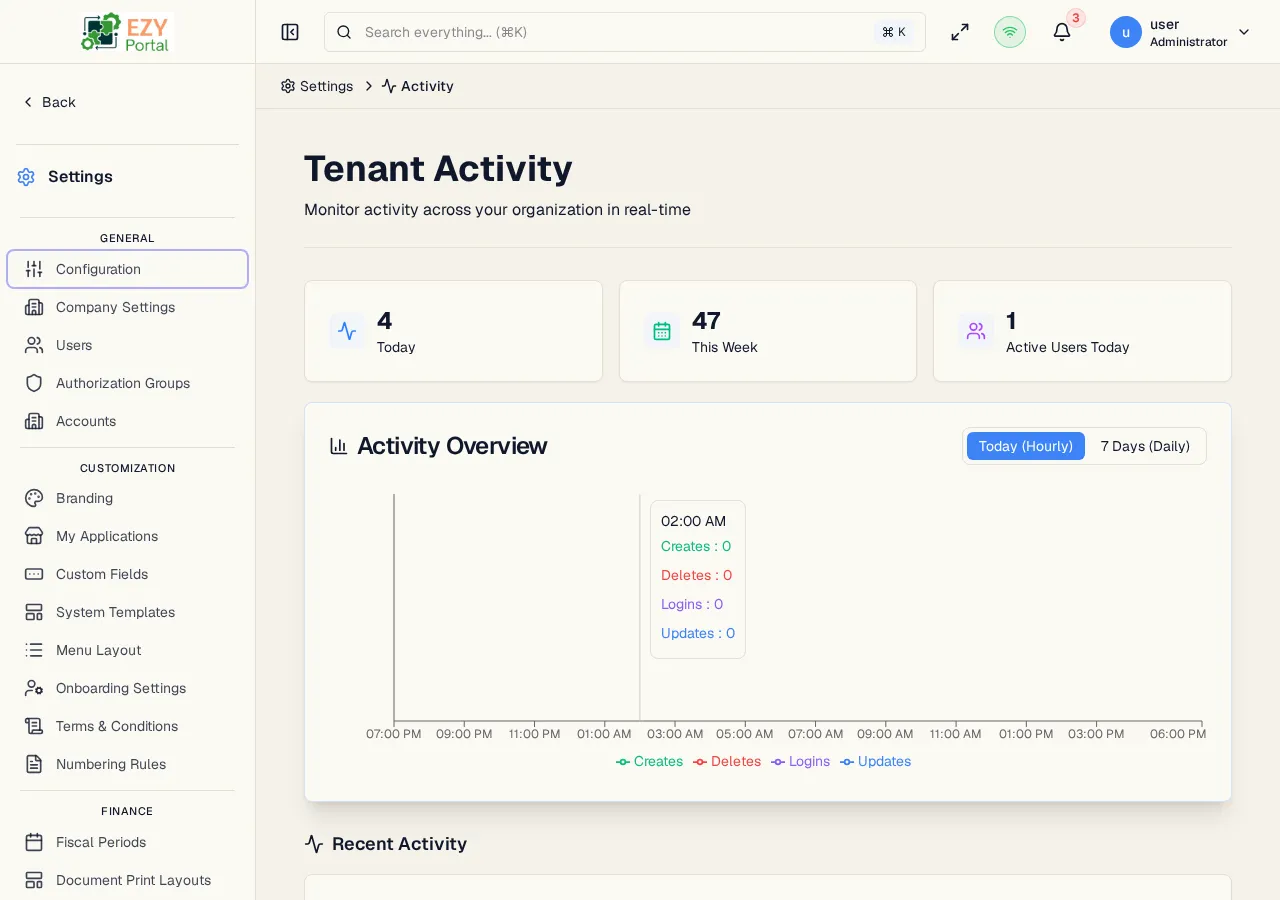
The Tenant Activity dashboard gives administrators an at-a-glance view of how the portal is being used. Three KPI cards summarize event counts for today and this week, an area chart breaks down actions by type over hourly or daily intervals, and a live timeline lists every recent audit event in chronological order. The dashboard receives real-time updates via SignalR so counts and timeline entries refresh without a page reload.
Accessing the Page
Section titled “Accessing the Page”- Route:
/tenant-activity - Menu Path: Settings → Data & Monitoring → Activity
- Primary audience: Tenant administrators and account administrators. Superusers see tenant-wide activity; account administrators see activity scoped to their account.
What you can do here
Section titled “What you can do here”- Monitor how many events occurred today and this week in real time.
- See how many users were active today.
- View an area chart of creates, updates, deletes, and logins broken down by hour (today) or by day (last 7 days).
- Browse a chronological timeline of recent audit events grouped by date, with user avatar, action badge, entity type, and relative timestamp for each entry.
- Click any timeline entry to open the full Audit Log detail dialog for that event.
- Load more timeline entries as you scroll to review historical activity.
Common tasks
Section titled “Common tasks”- Open Settings → Data & Monitoring → Activity.
- Check the three KPI cards to get a quick count of today’s events, this week’s events, and active users today.
- Use the Today (Hourly) / 7 Days (Daily) toggle on the chart to see the time granularity most useful for your investigation.
- Scroll the Recent Activity timeline to find the event you are investigating; click the entry to view its full detail including before/after field changes.
- The dashboard is only accessible to Superusers and Account Administrators. Users without either role see an access-denied message.
- KPI cards and the timeline update in real time via SignalR. No manual refresh is needed.
- The timeline loads 20 entries per page and auto-loads more as you scroll to the bottom.
- Clicking a timeline entry opens the same detail dialog available from the Audit Logs page — it shows the action, entity, actor, tenant, timestamp, IP address, user agent, and field-level before/after diff.
- Events triggered by API key access show the key name and a key icon instead of a user avatar. Two API key kinds are distinguished: Tenant API keys (issued by tenant administrators) and Service API keys (platform-level keys for service-to-service authentication, managed by system admins under Settings → System → Service API Keys).
Dashboard sections
Section titled “Dashboard sections”Top Section — KPI Cards
Section titled “Top Section — KPI Cards”
Three summary cards appear at the top of the page and update in real time.
| Card | What it shows |
|---|---|
| Today | Total number of audit events recorded since midnight today |
| This Week | Total audit events recorded in the current calendar week |
| Active Users Today | Count of distinct users who have performed at least one action today |
Middle Section — Activity Overview Chart
Section titled “Middle Section — Activity Overview Chart”
An interactive stacked area chart plots audit event volume over time. A toggle in the card header switches between two views:
| Toggle option | X-axis | What it shows |
|---|---|---|
| Today (Hourly) | Hours of the current day | Events grouped by clock hour since midnight |
| 7 Days (Daily) | Last 7 calendar days | Events grouped by day |
Each chart includes four stacked series:
| Series | Color | What it counts |
|---|---|---|
| Creates | Green | New record creation events |
| Updates | Blue | Record update and edit events |
| Deletes | Red | Record deletion events |
| Logins | Purple | User sign-in events |
Hovering over any chart point shows an exact count per series for that time interval. The legend below the chart identifies each color.
Bottom Section — Recent Activity Timeline
Section titled “Bottom Section — Recent Activity Timeline”
A chronological timeline lists audit events grouped by date heading (Today, Yesterday, or a calendar date). Each entry shows:
- User avatar — a colored circle with the user’s initials
- User name or API key name
- Action badge — color-coded badge showing the action type (Create, Update, Delete, Login, etc.)
- Entity type — the type of record affected (e.g., Business Partner, Item)
- Relative timestamp — how long ago the event occurred (e.g., “3 minutes ago”)
Click any entry to open the Audit Log detail dialog for that event.
The timeline loads 20 entries per page. Scroll to the bottom to auto-load more entries. Use the full Audit Logs page when you need filtering, sorting, or CSV export.
Related Pages
Section titled “Related Pages”- Audit Logs — filterable, sortable log list with CSV export