Dashboard
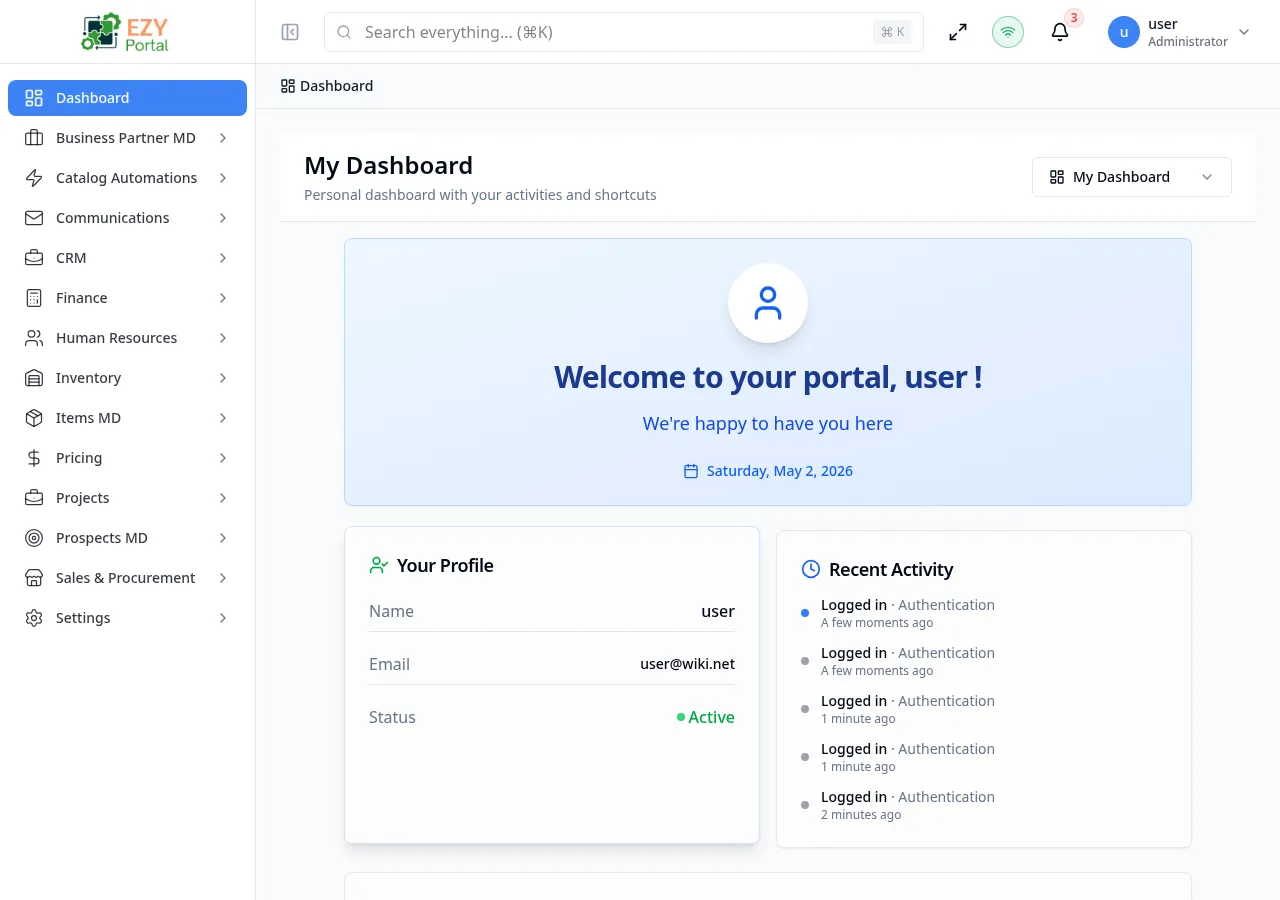
The Dashboard page is the entry point of EZY Portal after login. Every authenticated user lands here. The portal automatically routes each user to their default dashboard based on role: system administrators see the Admin Dashboard, and all other users see My Dashboard. Additional dashboards registered by microservices appear alongside the built-in ones. A dashboard switcher in the header lets users move between all dashboards that are visible to them.
Accessing the Page
Section titled “Accessing the Page”- Route:
/dashboardor/dashboard/:dashboardId - Menu Path: Home — the first item in the portal navigation sidebar
- Access: All authenticated users. Which dashboards are visible depends on role and microservice registration.
What you can do here
Section titled “What you can do here”- Land on your default dashboard immediately after logging in.
- Switch between available dashboards using the Dashboard Switcher in the page header.
- Search dashboard names and descriptions inside the switcher.
- Pin a dashboard or mark one as default using Manage Dashboards.
- Review system health, security events, infrastructure status, and tenant statistics (Admin Dashboard).
- Review your profile summary, recent personal activity, and quick-access help links (My Dashboard).
Dashboard sections
Section titled “Dashboard sections”The portal ships with two built-in dashboards. Microservice dashboards may add more.
My Dashboard (all users)
Section titled “My Dashboard (all users)”All authenticated users have access to My Dashboard. It contains a personal view of the portal.
Dashboard header and switcher
Section titled “Dashboard header and switcher”When the user has more than one dashboard available, a header bar appears at the top of the dashboard content area. It shows the current dashboard title and description on the left and the Dashboard Switcher dropdown on the right.

When only one dashboard is available, the switcher is hidden and the header bar does not appear.
Welcome card
Section titled “Welcome card”A greeting card at the top of the page displays a time-of-day greeting (Good morning / Good afternoon / Good evening), the user’s full name, and today’s date.

Profile summary and recent activity
Section titled “Profile summary and recent activity”Two side-by-side cards appear below the welcome card. The left card (Your Profile) shows the signed-in user’s name, email address, and account status (Active). The right card (Recent Activity) lists up to five of the user’s most recent audit events.
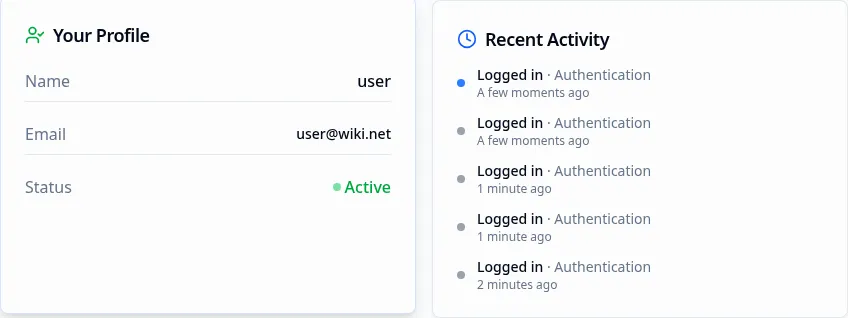
Each activity entry in the Recent Activity card shows:
| Field | Description |
|---|---|
| Action | The operation performed (Logged in, Updated, Created, Deleted, etc.) |
| Entity type | The type of record affected, translated using the entity registry |
| Relative timestamp | How long ago the event occurred (e.g., “3 minutes ago”) |
When no activity exists for the user, an empty-state message appears. Activity loads from the portal audit log and refreshes on page load.
Help section
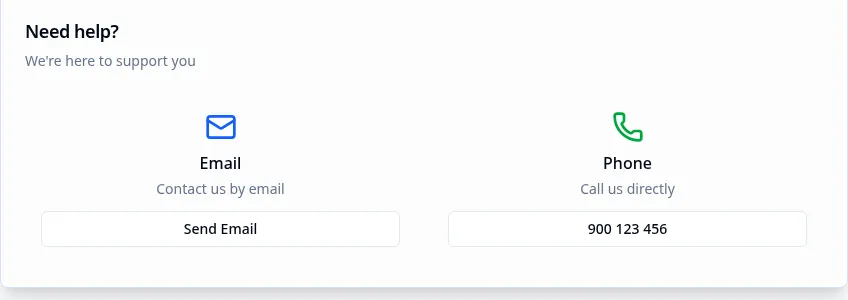
Section titled “Help section”A card with two contact options for reaching support. Email opens a mailto link; Phone displays a support telephone number. Both values are configurable per tenant.
Tip of the day
Section titled “Tip of the day”An amber-styled card shows a rotating portal tip. The tip is driven by localization strings and changes periodically.

Admin Dashboard (system administrators only)
Section titled “Admin Dashboard (system administrators only)”The Admin Dashboard is only visible to users with the requireSystemAdmin permission. It provides a real-time system health and security overview.

The Admin Dashboard contains the following sections:
Health metrics cards
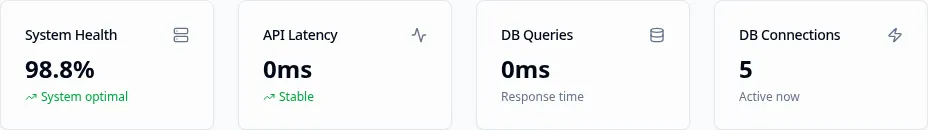
Section titled “Health metrics cards”Four metric cards at the top show live system performance data:
| Card | What it shows |
|---|---|
| System Health | Overall health percentage; below 85% triggers an “Requires Attention” trend indicator |
| API Latency | Average API response time in milliseconds; flags high error rate when above 5% |
| DB Queries | Current database query response time in milliseconds |
| DB Connections | Number of active database connections right now |
Each card updates when the dashboard data refreshes.
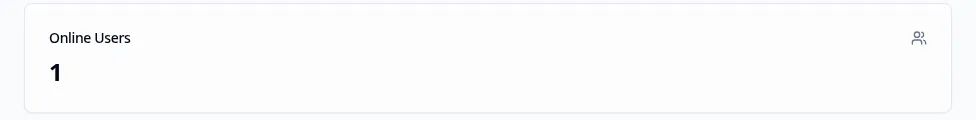
Online Users card
Section titled “Online Users card”A single metric card showing how many users are currently online. Clicking the card opens the Online Users side sheet with a full list of active sessions.
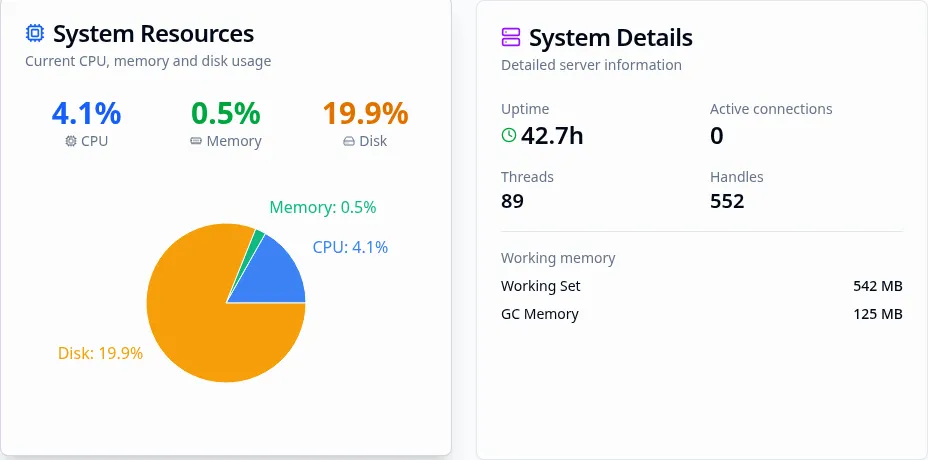
System Resources and System Details cards
Section titled “System Resources and System Details cards”A two-column grid shows CPU, memory, and disk usage as a pie chart (System Resources) alongside numeric system metrics including uptime, active connections, thread count, handles, and working memory (System Details).
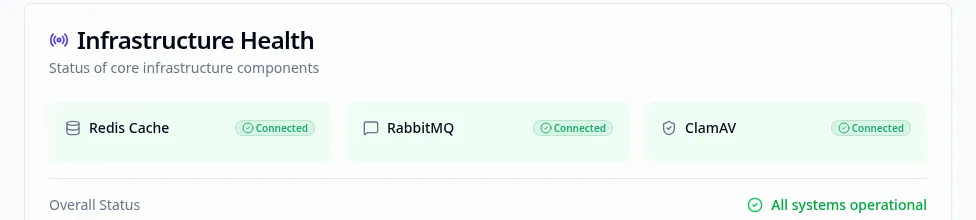
Infrastructure Health card
Section titled “Infrastructure Health card”Shows the operational status of the three infrastructure components:
| Component | What it monitors |
|---|---|
| Redis Cache | Cache layer availability; shown as Connected / Warning / Unhealthy |
| RabbitMQ | Message queue availability; same status values |
| ClamAV | Virus scanner availability; only shown when ClamAV is enabled in the deployment |
An overall status line at the bottom reads All systems operational (green) or Some Issues Detected (amber).
Security Overview
Section titled “Security Overview”The Security Overview section has metric cards, a trend chart, and two detail cards.
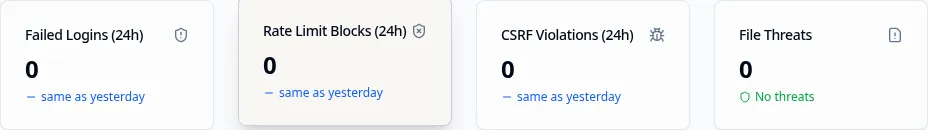
Security metric cards (four cards in a row):
| Card | What it shows | Drill-down |
|---|---|---|
| Failed Logins (24h) | Count of failed login attempts in the last 24 hours | Opens a detailed list of failed login events |
| Rate Limit Blocks | Count of rate-limit violations in the last 24 hours | Opens rate-limit violation details |
| CSRF Violations | Count of CSRF protection triggers in the last 24 hours | Opens CSRF violation details |
| File Threats | Count of infected/total file scans in the last 24 hours | Opens file scan threat details |
Each card shows a trend indicator (up/down/stable) compared to the previous day.
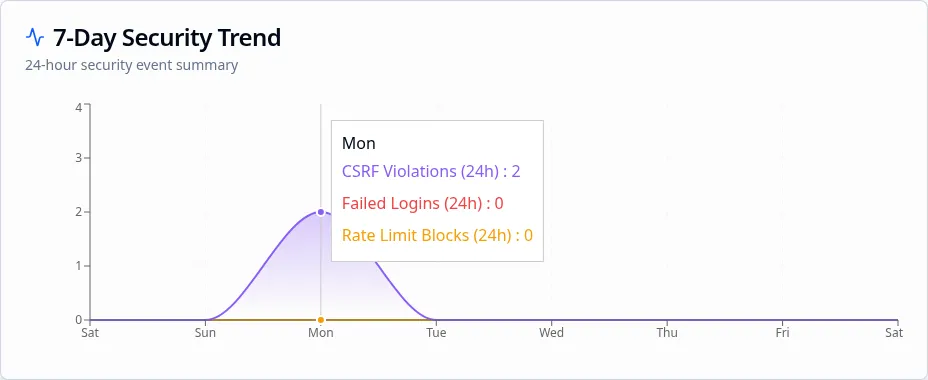
Security trend chart: A 7-day area chart plots failed logins, rate-limit blocks, and CSRF violations over the past week. Hover over any point to see exact counts per day.
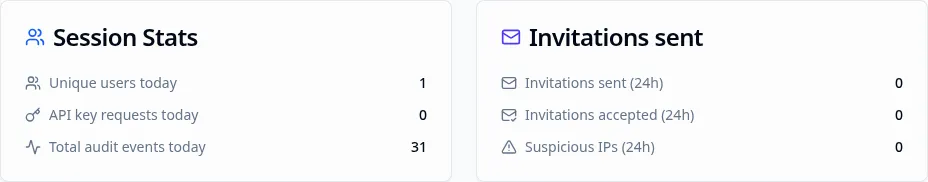
Session stats card: Shows unique users today, API key requests today, total audit events, and any account lockouts in the last 24 hours. Account lockouts are clickable and open a drill-down sheet.
Invitations card: Shows invitations sent, invitations accepted, and suspicious IP addresses in the last 24 hours. Each row is clickable and opens a drill-down sheet for the corresponding event type.
Clicking any metric card or drill-down row opens a Security Drill-down Side Sheet with a paginated list of the underlying events.
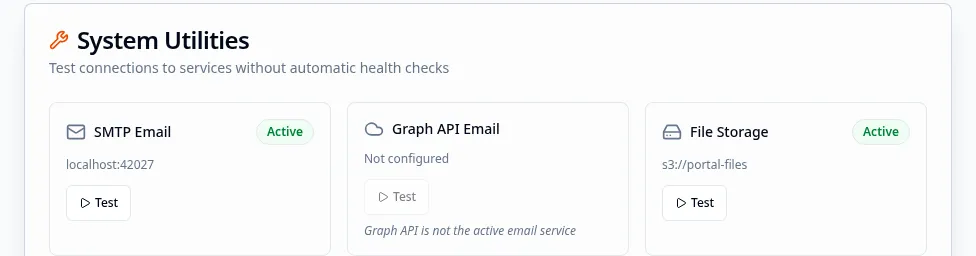
System Utilities card
Section titled “System Utilities card”A card containing connectivity test actions for the platform’s external services (such as SMTP email, Graph API email, and file storage). Clicking Test on any service verifies the current connection and reports the result.
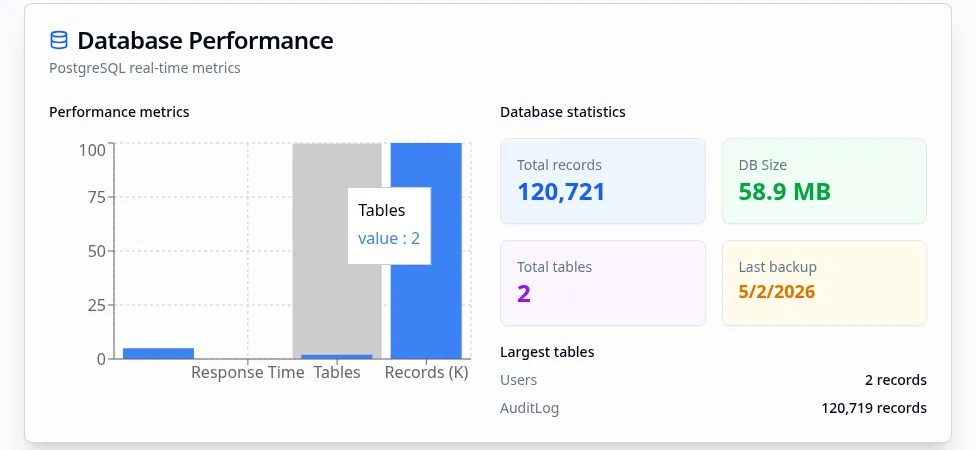
Database Performance card
Section titled “Database Performance card”A chart-based card showing PostgreSQL real-time metrics including response time, table count, and record counts alongside database statistics (total records, DB size, total tables, last backup date, and the largest tables by record count).
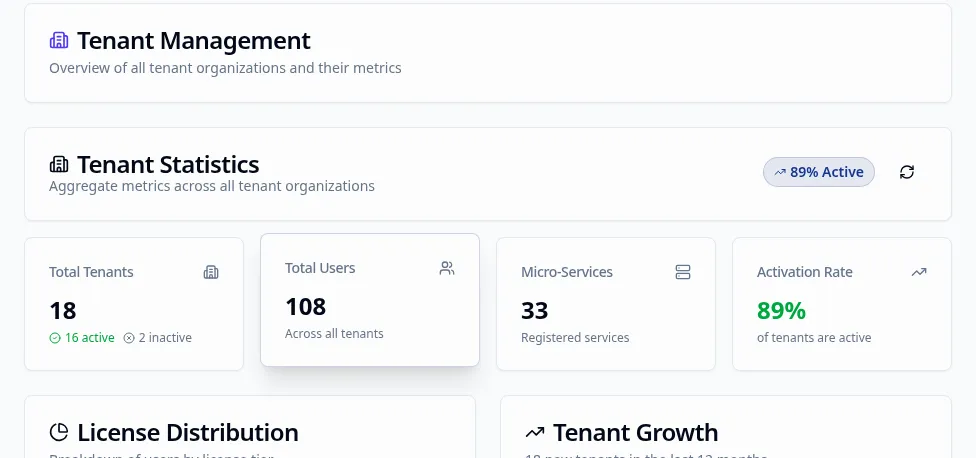
Tenant Management section
Section titled “Tenant Management section”Only shown in multi-tenant mode. Contains three components:
| Component | What it shows |
|---|---|
| Tenant Statistics | Total tenant count, active tenants, and license usage |
| Tenant Distribution Chart | Breakdown of tenants by plan or status (hidden in unlimited-license mode) |
| Tenant Growth Chart | Tenant count over time (hidden in unlimited-license mode) |
Last Update card
Section titled “Last Update card”A small card at the bottom of the Admin Dashboard showing when dashboard metrics were last refreshed and how frequently they update.

Microservice dashboards
Section titled “Microservice dashboards”Microservices can register additional dashboards via the DashboardRegistry. These appear alongside the built-in dashboards in the switcher. They load using Module Federation (remote component) or a direct route redirect. If a registered microservice becomes unavailable, its dashboard shows a “Failed to Load Dashboard” error with a Retry button.
Filters and date ranges
Section titled “Filters and date ranges”The Dashboard page itself has no global date filter. Individual sections within the Admin Dashboard operate on fixed windows:
| Section | Data window |
|---|---|
| Security metric cards | Last 24 hours |
| Security trend chart | Last 7 days |
| Health metrics | Real-time / last polled interval |
| Tenant statistics | All-time totals |
My Dashboard shows the signed-in user’s last 5 activity entries with no date filter.
Permissions and role visibility
Section titled “Permissions and role visibility”| Dashboard | Visibility condition |
|---|---|
| Admin Dashboard | Requires requireSystemAdmin flag on the user account |
| My Dashboard | Available to all authenticated users (audience: 'all') |
| Microservice dashboards | Depend on each microservice’s own visibility and role rules |
When a user has access to only one dashboard, the switcher is hidden and that dashboard loads directly. When a user has access to multiple dashboards, the switcher appears and a default can be set.
If no default dashboard is set and multiple are available, the portal shows a Select a Dashboard grid from which the user picks one.
If the URL contains an unrecognized dashboard ID, the page shows a Dashboard Not Found state and lists the available dashboards.
- The Admin Dashboard loads live system metrics on each page visit. Metrics do not auto-refresh while the page is open; reload the page to get updated values.
- An MFA Banner appears at the top of the dashboard page when multi-factor authentication is not yet configured for the signed-in user. Dismissing or completing MFA setup removes the banner.
- Microservice dashboards that fail to load show a retry option. If the service is permanently unavailable, contact your system administrator.
- The Dashboard Switcher only shows dashboards that are both registered and visible to the current user. Hidden dashboards (toggled off in Manage Dashboards) do not appear.
Related Pages
Section titled “Related Pages”- Profile — View and update your user profile, name, email, and avatar
- Notifications — Review portal notifications and configure preferences
- Users — Manage portal user accounts (administrators)
- Tenants — Manage tenants from the Admin Dashboard (system administrators)
- Activity — Full tenant activity dashboard with real-time event timeline
- Audit Logs — Filterable audit log with CSV export