CRM Dashboard
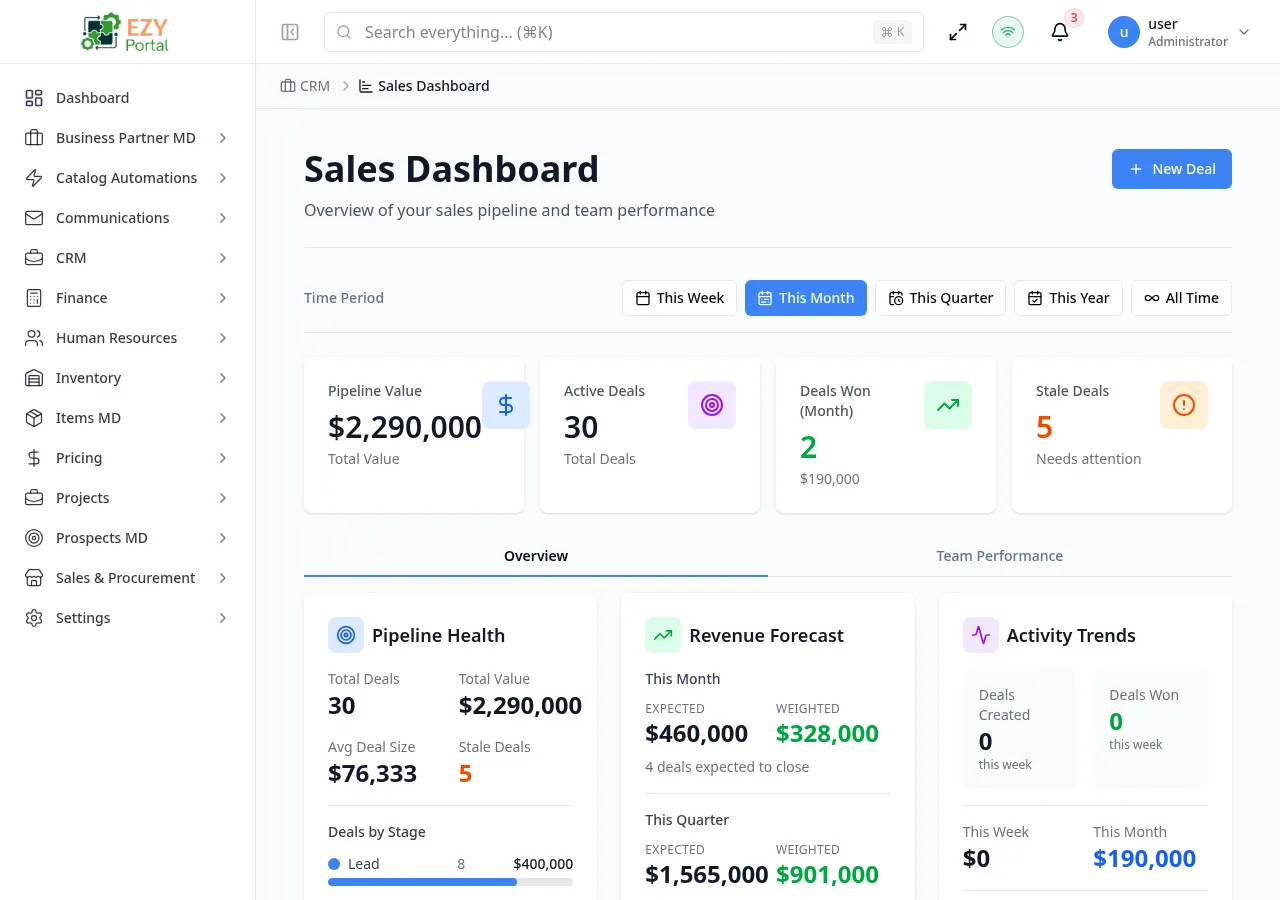
The CRM Dashboard gives sales managers and team members an at-a-glance view of pipeline health and team performance. Four KPI cards show key numbers for the selected time period, two tabs reveal detailed cards for pipeline health, revenue forecast, and activity trends, and a team leaderboard ranks reps by deals won and revenue generated. All data refreshes automatically when you change the time period.
Accessing the Page
Section titled “Accessing the Page”- Route:
/(CRM module root) - Menu Path: CRM → Dashboard
Time Period Filter
Section titled “Time Period Filter”A period selector bar appears at the top of the dashboard and controls all KPI cards, charts, and tables on the page.
| Option | What it covers |
|---|---|
| This Week | Current calendar week |
| This Month | Current calendar month |
| This Quarter | Current calendar quarter |
| This Year | Current calendar year |
| All Time | No date restriction |
The selected period is highlighted. Changing the period triggers a data reload for all sections.
Dashboard sections
Section titled “Dashboard sections”KPI Cards
Section titled “KPI Cards”Four summary cards appear at the top of the page, each linking to a related module page.
| Card | Metric | Link |
|---|---|---|
| Pipeline Value | Total deal amount across all active stages in the selected period | Opens Pipeline |
| Active Deals | Number of deals in active (non-closed, non-on-hold) stages | Opens Deal List |
| Deals Won | Count of deals marked Won in the selected period, with total revenue below | No link |
| Stale Deals | Deals that have not progressed in a significant amount of time | No link |
Stale deals are highlighted in orange. A high stale-deal count signals deals that need attention.
Overview Tab — Pipeline Health
Section titled “Overview Tab — Pipeline Health”The Overview tab contains three side-by-side cards.
Pipeline Health card shows:
| Metric | Description |
|---|---|
| Total Deals | Count of all deals in the pipeline |
| Total Value | Combined deal amounts |
| Avg Deal Size | Total value divided by deal count |
| Stale Deals | Deals without recent activity |
A horizontal bar chart below the metrics lists every active stage with a colored indicator, the deal count, and the total value for that stage. Bars are scaled relative to the highest-value stage.
At the bottom, a status summary shows the split between Active, Won, and Lost deals for the period.
Overview Tab — Revenue Forecast
Section titled “Overview Tab — Revenue Forecast”The Revenue Forecast card breaks down expected and weighted revenue:
| Row | Description |
|---|---|
| This Month — Expected | Total deal amounts expected to close this month |
| This Month — Weighted | Expected amounts multiplied by each deal’s probability percentage |
| This Quarter — Expected | Same as above for the full quarter |
| This Quarter — Weighted | Probability-weighted forecast for the quarter |
A deal count shows how many deals are expected to close in each period. The weighted forecast provides a more conservative, realistic projection by discounting deals with lower probability.
Overview Tab — Activity Trends
Section titled “Overview Tab — Activity Trends”The Activity Trends card shows recent team activity:
| Metric | Description |
|---|---|
| Deals Created (This Week) | New deals opened in the current week |
| Deals Won (This Week) | Deals closed as Won this week |
| Revenue This Week | Revenue from won deals this week |
| Revenue This Month | Revenue from won deals this month |
| Avg Time to Close | Average days from deal creation to Won status |
Team Tab — Team Performance
Section titled “Team Tab — Team Performance”Switching to the Team Performance tab shows a ranked leaderboard of sales team members.
| Column | Description |
|---|---|
| Team Member | User name; top 3 show gold/silver/bronze trophy icons |
| Activities | Count of activities logged by this user |
| Active | Deals currently open |
| Won | Deals marked Won (with Lost count in grey if any) |
| Win Rate | Percentage of Won deals vs. Won + Lost |
| Pipeline | Total value of active deals |
| Revenue | Total revenue from Won deals in the period |
Win rate is shown in green when 50% or above, and orange below 50%.
Permissions and role visibility
Section titled “Permissions and role visibility”All authenticated CRM users can access the dashboard. The data shown is scoped according to the user’s region and deal visibility settings — users outside a deal’s scope may see reduced counts.